
American Trucking Industry – Statistics and Facts You Should Know
Did you know that the $940.8 billion revenue from trucking is responsible for nearly 80.7% of the nation’s freight by weight?
Key Takeaways
Well, this is just one incredible statistic about the American trucking industry. There are more. To know about them, keep reading this blog, as we will look deeper at the US trucking industry statistics..
A Glance at the American Trucking Industry
The trucking industry is the backbone of the United States economy and is responsible for transporting everything from construction materials to electronics to perishable items to gasoline to anything. It serves as a crucial lifeline between manufacturers, distributors, and wholesale suppliers.
Despite fluctuating fuel costs and modest growth in earnings in 2019 and 2020, the business environment for truckers has been largely favorable since 2018. Not only that, the trucking sector performed well during the pandemic periods too.
Until 2022, the industry is solely accountable for employing more than 8.4 million people (excluding self-employed truckers) and has transported 11.46 billion tonnes of primary shipments. And the graph is still rising exponentially.
As we are in the second half of 2023, it is vital to know and understand the latest trends and key statistics that are shaping the American trucking industry. From the ongoing shortage of truck drivers to its rising impact on states and the global economy to increasing truck insurance coverages and surging fuel prices, many factors are contributing to the trucking sector.
So, keep reading to discover the much-needed insights.
Quick Facts: Delivery Truck Drivers and Driver/Sales Workers (2022)
| May 2022, Median Pay | $46,310 per year |
| Typical Entry-Level Education | High school diploma or equivalent |
| Work Experience in a Related Occupation | None |
| On-the-job Training | Short-term on-the-job training |
| Number of Jobs, 2022 | 1,705,600 |
| Job Outlook, 2022-32 | 10% (Much faster than average) |
| Employment Change, 2022-32 | 175,700 |
American Trucking Industry Statistics by Trucker Demographics
According to the Women in Trucking Association, the percentage of women professional drivers has increased to 13.7 percent in 2022 from 7.89% in 2018, which is a nearly 6% rise.
This increased percentage is the result of a nationwide industry push to employ more women drivers in response to the massive truck driver shortage.
The American Trucking Association has warned that the deficit might increase to 160,000 drivers by 2030, with a lack of 80,000 drivers projected in 2021.
Furthermore, the WIT Index states that the percentage is considerably higher for Class A licensed road drivers (which includes any driver who can handle vehicles weighing over 26,000 pounds) and is 14%, which is nearly twice as high as it was just five years ago.
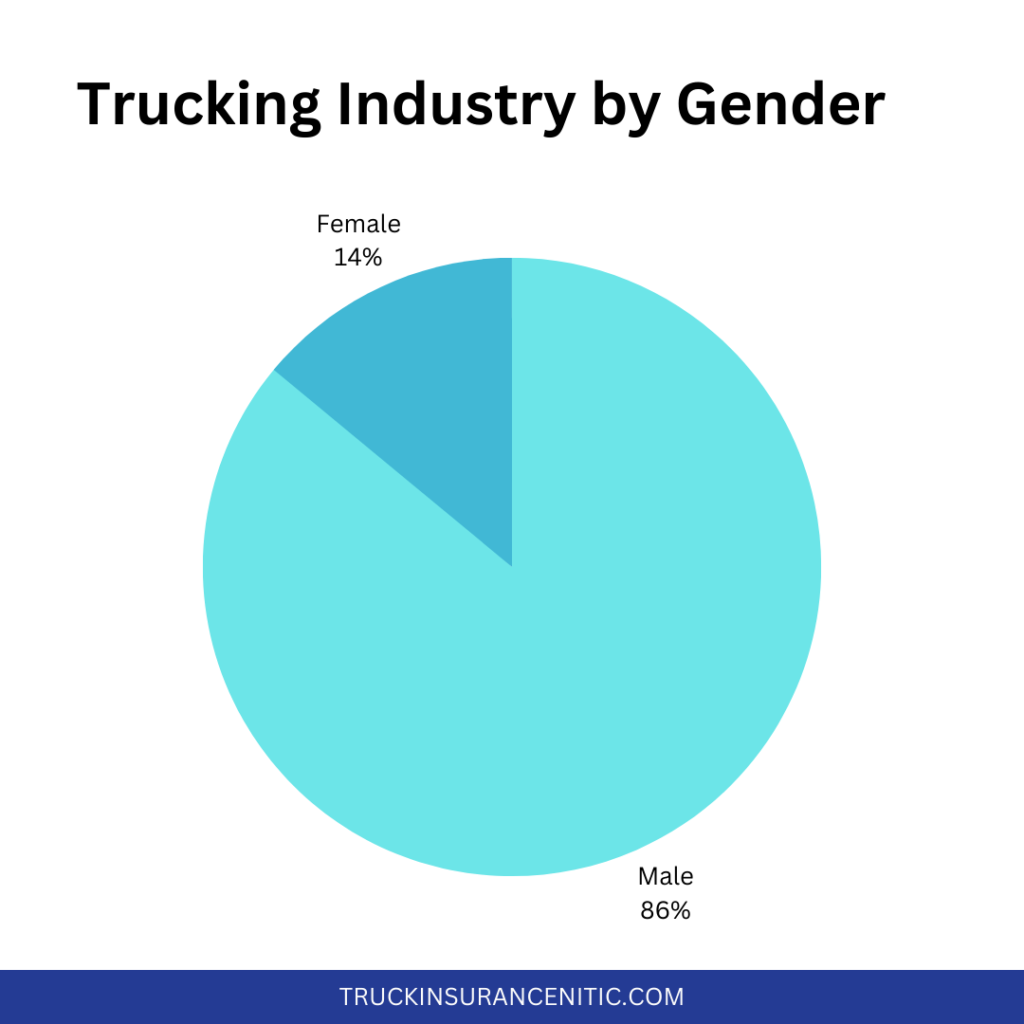
| Trucking Industry by Gender | |
| Male | 86% |
| Female | 14% |
The billion-dollar U.S. trucking industry is taking a new turn with the recruitment of LGBTQ+ truck drivers. According to Jacob Martin, a member of WKYU, the consistent hiring of drivers among women and the LGBTQ+ community is helping the transportation department resolve the issue of driver shortages.
As of 2023, there are no official reports on the number of LGBTQ+ truck drivers; however, unofficial studies state that they comprise 4% of all truck drivers. Also, they are running a Facebook group with the name LGBT Truckers, which has a following of 6300 people.
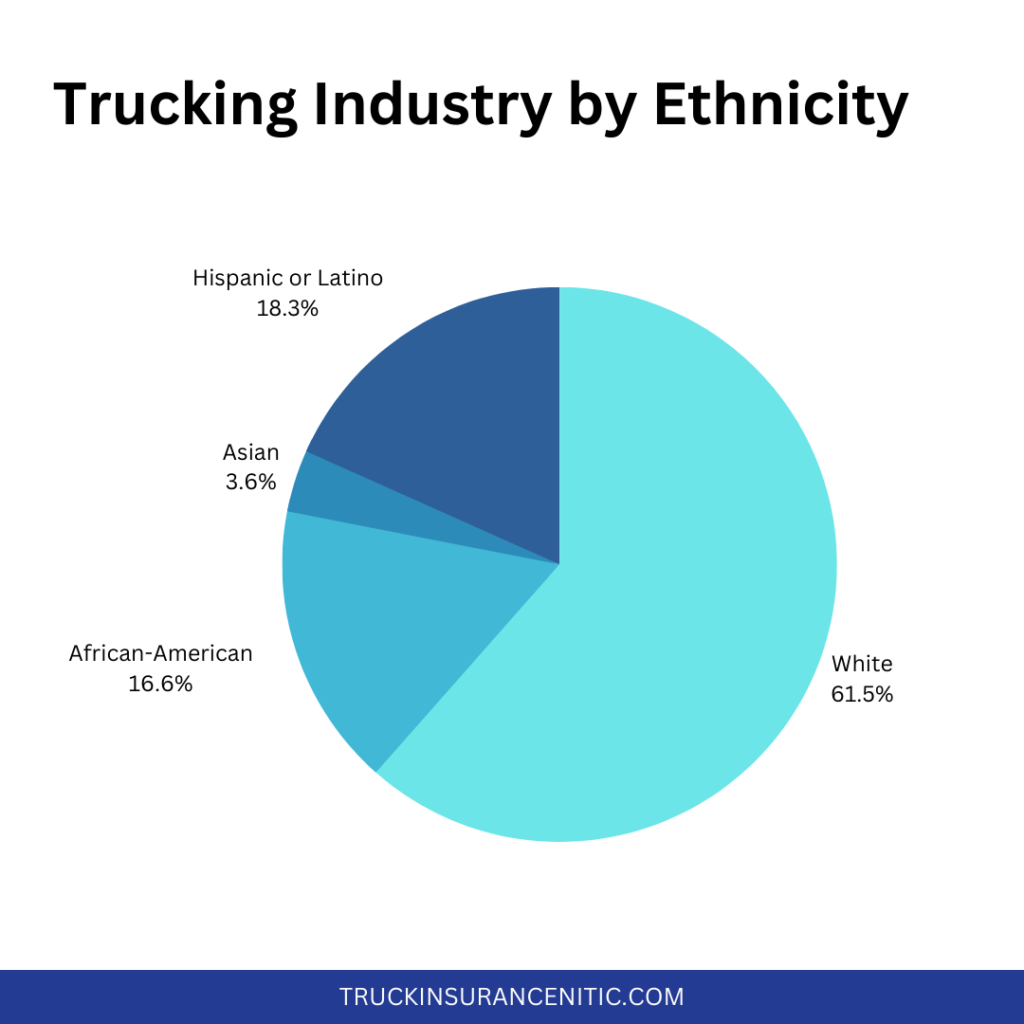
According to a 2022 survey of the U.S. Bureau of Labor Statistics, the breakdown of employed commercial truck drivers based on their ethnicity and racial demographics is as follows:
| Trucking Industry by Ethnicity | |
| White | 73.2% |
| Black or African-American | 19.7% |
| Asian | 4.3% |
| Hispanic or Latino | 21.8% |
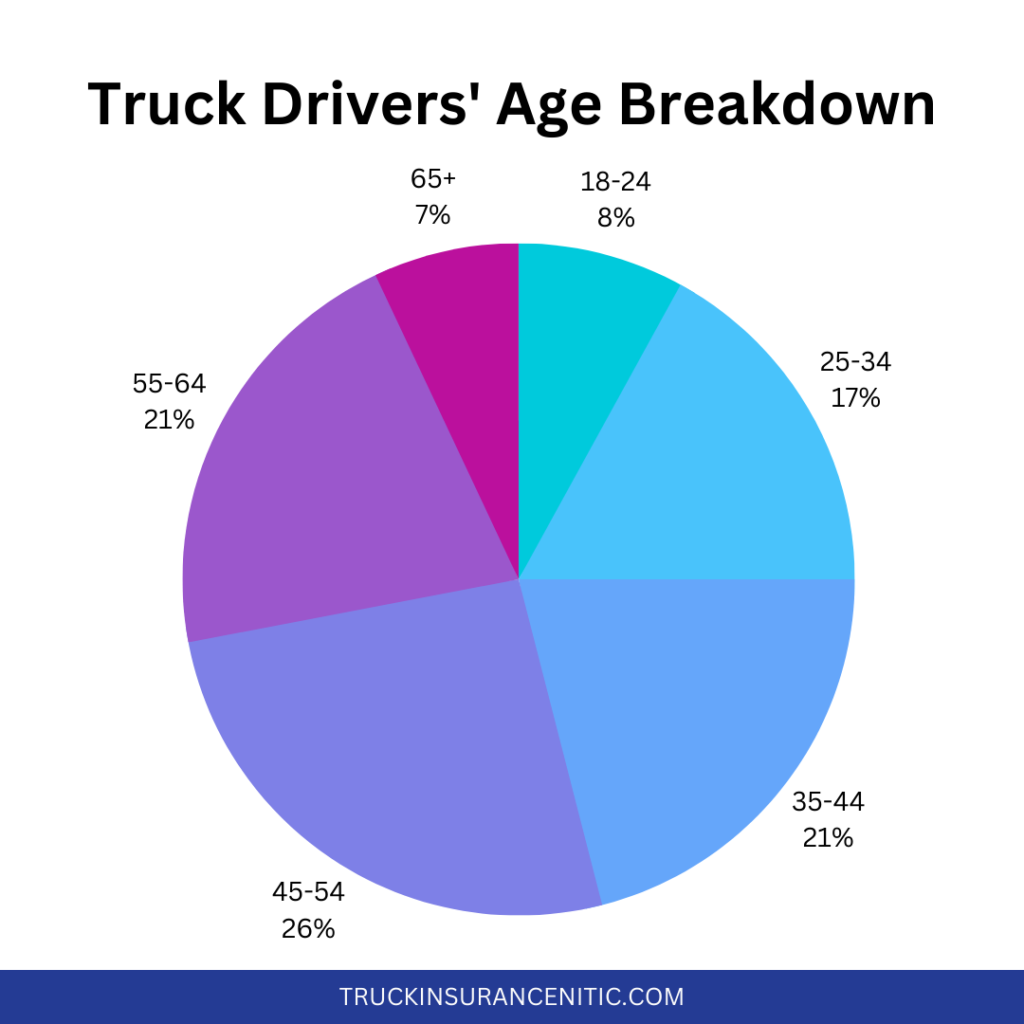
Age in the trucking sector is merely a number. The median age of the majority of truck drivers falls in the range of 45-54.
Contrary to 42 for all other American workers, the average age of over-the-road truck drivers is 46. This median age is even greater in some subsectors. For instance, the typical age of private fleet drivers is 57.
Additionally, to cross state lines in a tractor-trailer, drivers must be 21 years old. This is why interstate motor carriers consequently miss out on those who are between the ages of 18 and 21.
And, since they are able to begin their professions at a younger age, these youngsters frequently find jobs in the construction, grocery stores, and fast food sectors.
Moreover, the average age of newly trained truck drivers in 2023 is 35 years.
| Professional Truck Drivers’ Age Breakdown | |
| 16-24 | 8% |
| 25-34 | 17% |
| 35-44 | 21% |
| 45-54 | 26% |
| 55-64 | 21% |
| 65+ | 7% |
Regardless of the trucks they operate (light-duty, medium-duty, or heavy-duty), the typical entry-level education for truckers is a high school diploma or equivalent.
The unemployment rate in the trucking sector is lower.
Despite having lower educational qualifications, the unemployment rate of the trucking sector is lower than the other ones (4.1% unemployed vs. 5.3% for the rest of the industry’s workers). However, they also tend to have less health insurance, which is why truck companies spend extra on their health coverage.
Breakdown of the bare minimum education and work experience required to enter the different trucking businesses.
| 2022 National Employment Matrix title | 2022 National Employment Matrix code | Typical education needed for entry | Work experience in a related occupation | Typical on-the-job training needed to attain competency in the occupation |
| Heavy and tractor-trailer truck drivers | 53-3032 | Postsecondary nondegree award | None | Short-term on-the-job training |
| Light truck drivers | 53-3033 | High school diploma or equivalent | None | Short-term on-the-job training |
| Industrial truck and tractor operators | 53-7051 | No formal educational credential | None | Short-term on-the-job training |
| Tank car, truck, and ship loaders | 53-7121 | No formal educational credential | None | Short-term on-the-job training |
Furthermore, the high school diploma only comprises 32% of truck drivers. There are other levels of degrees, which are as follows:
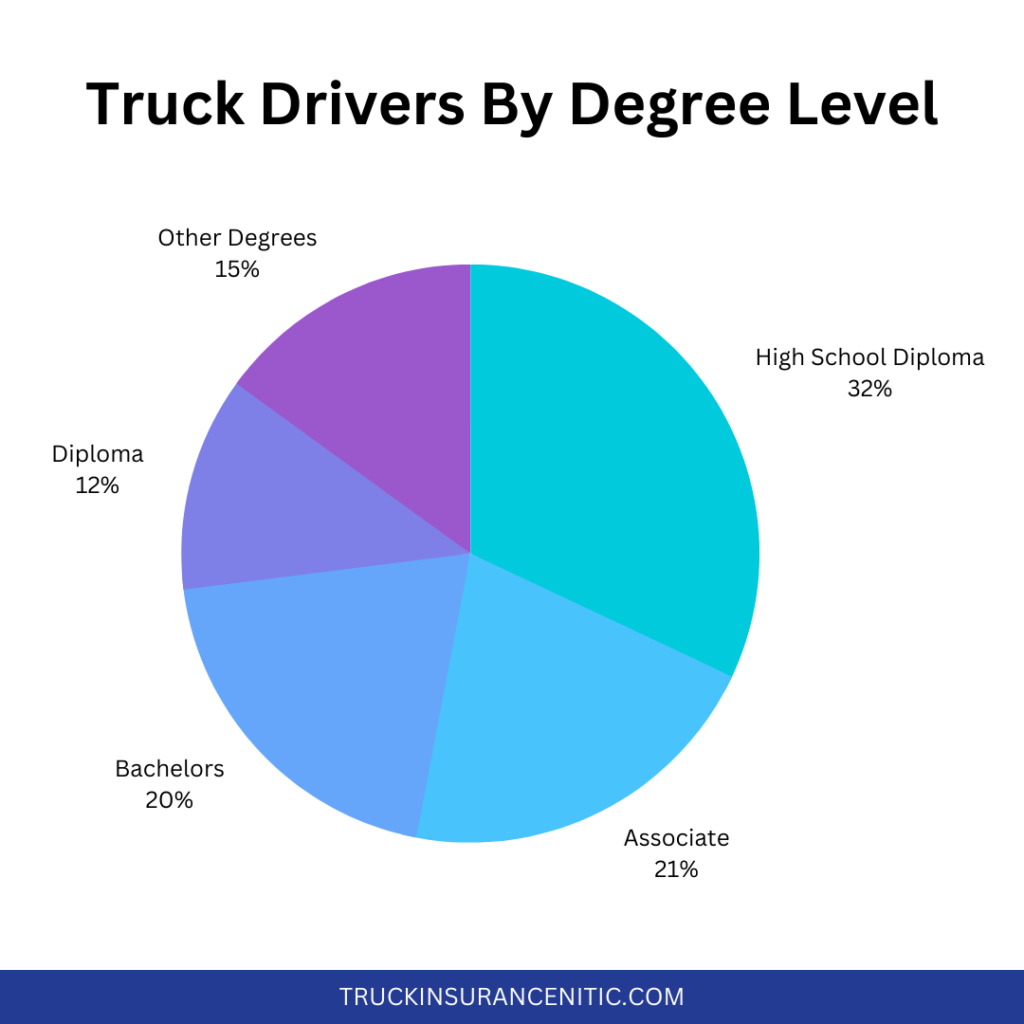
| Professional Truck Drivers By Degree Level | |
| High School Diploma | 32% |
| Associate | 21% |
| Bachelors | 20% |
| Diploma | 12% |
| Other Degrees | 15% |
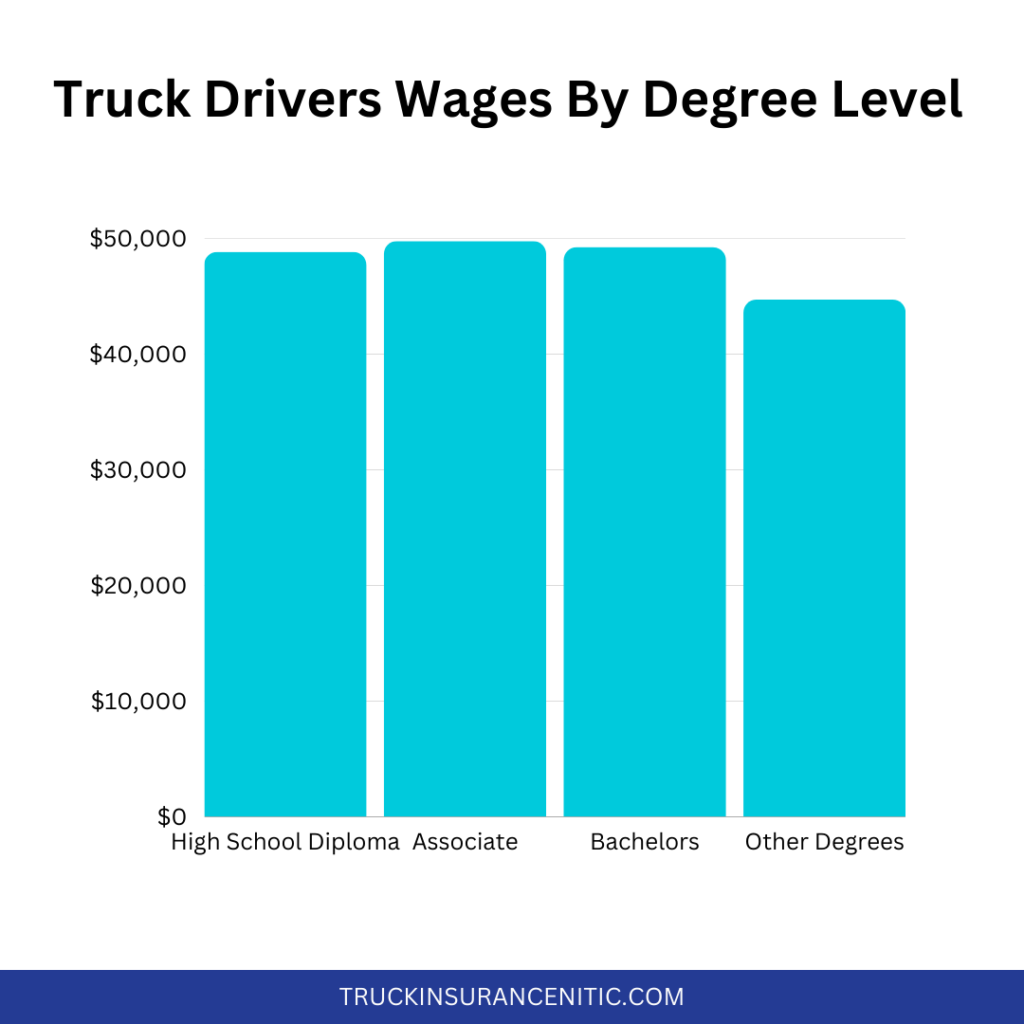
Having lower educational attainment for entry-level truckers does not mean that they would be qualified for the same wages. According to the Zippia report, employers with associate degrees have the highest wages, followed by bachelor’s, high diplomas, and master’s degrees.
| Professional Truck Drivers Wages By Degree Level | |
| Associate | $49,765 |
| Bachelors | $49,232 |
| High School Diploma or Less | $48,810 |
| Master’s Degree | $44,687 |
American Trucking Industry Statistics by Employment
According to ATA’s report, around 8.4 million people got employment via jobs related to the trucking sector, including truck drivers, sales workers, motor vehicle operators, laborers, and anyone else who needed to run the trucking business and contributed to the nation’s economy. Among this number, 3.54 million were truck drivers, which is a roughly 1.5% increase from 2021.
The reason is crystal clear. Even though we are living in an era of advanced technologies where deliveries are being done by drones, the general demand for delivering food, medicines, groceries, and other things via trucks remains the same.
As per the U.S. BLS, the overall projected employment of truckers in all occupations from 2022-2032 is expected to grow by 10%. The below table shows projected employment by industry in detail:
| Employment projections data for delivery truck drivers and driver/sales workers, 2022-32 | |||
| Occupational Title | Employment, 2022 | Projected Employment, 2032 | Change, 2022-32 in % |
| Delivery truck drivers and driver/sales workers | 1,705,600 | 1,881,300 | 10 |
| Driver/sales workers | 541,000 | 582,900 | 8 |
| Light truck drivers | 1,164,600 | 1,298,400 | 11 |
American Trucking Industry Statistics by Pay
The average annual pay in the trucking sector varies with the occupation and the associated industry. For instance,
The biggest industries in which driver/sales workers were employed paid them on average the following salaries in May 2022:
| Median annual wages for driver/sales workers, May 2022 | |
| Wholesale trade | $44,310 |
| Retail trade | $34,680 |
| Restaurants and other eating places | $26,450 |
The biggest industries in which light truck drivers were employed paid them on average the following salaries in May 2022:
| Median annual wages for light truck drivers, May 2022 | |
| Couriers, and messengers | $46,720 |
| Wholesale trade | $38,240 |
| Retail trade | $30,140 |
Following are the average pay statistics of a trucker, including all occupations in the U.S. economy.
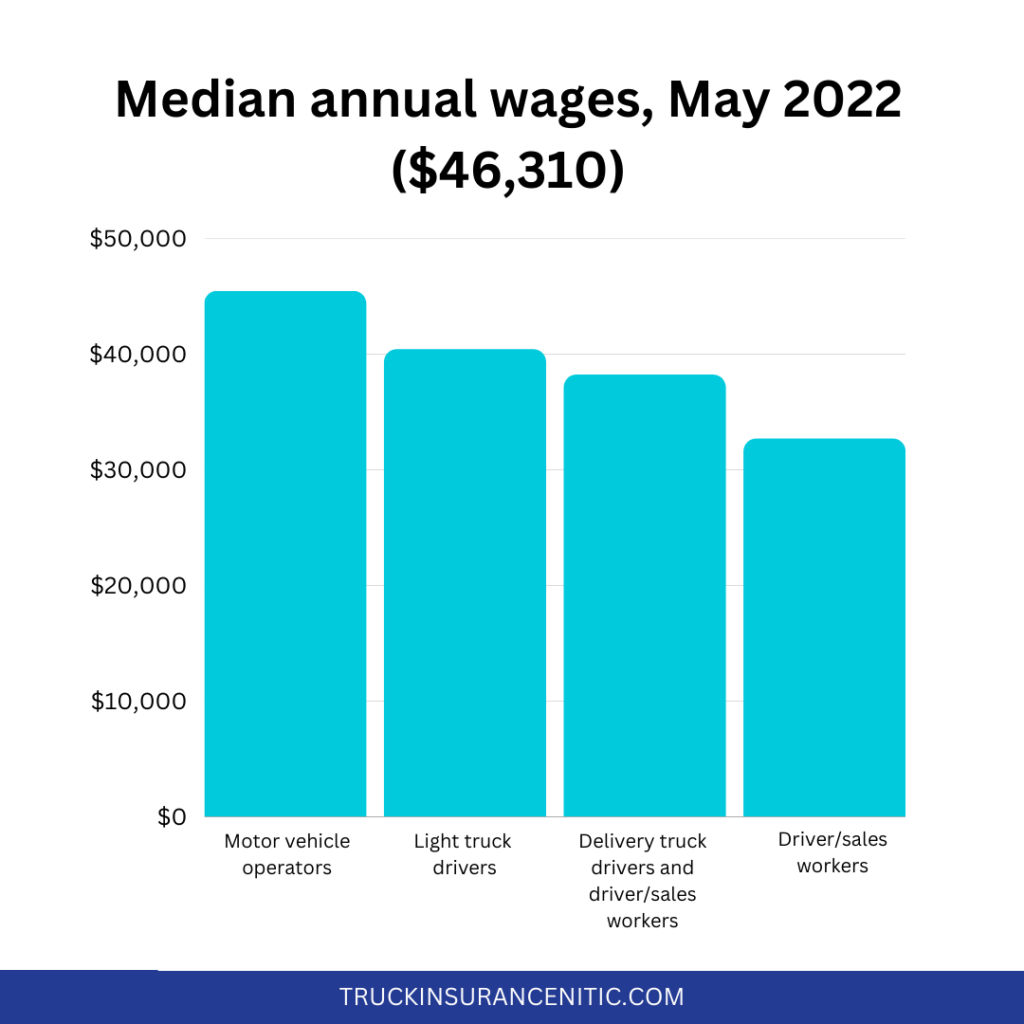
| Median annual wages, May 2022 ($46,310) | |
| Motor vehicle operators | $45,460 |
| Light truck drivers | $40,410 |
| Delivery truck drivers and driver/sales workers | $38,220 |
| Driver/sales workers | $32,690 |
Furthermore, the majority of drivers are full-time employees, and some put in more than 40 hours every week. Those with set routes may have to start their shifts very early or stay till late at night.
Additionally, the drivers and salespeople can get tips or commissions on the goods they sell as an extra to their hourly pay.
American Trucking Industry Statistics by Tonnage
The trucking industry is considered an index of the U.S. economy. In 2022, 11.46 billion tonnes of freight were moved by trucks, accounting for 72.6% of the tonnage carried by all domestic freight transportation modes, including manufactured and retail items. A total of $940.8 billion, or 80.7%, of all transportation modes’ income was collected by motor carriers.
In 2023, after gaining 1.1% in July, the more sophisticated seasonally adjusted (SA) For-Hire Truck Tonnage Index from the American Trucking Associations increased by 0.2% in August. The index rose from 115 in July to 115.3 (2015=100) in August.
However, given that the tonnage surged in September of last year, year-over-year assessments are still challenging. Therefore, it is unclear that tonnage will become positive in comparison to a year ago for at least another month or two.
In 2022, trucks moved,
- 61.9% of the surface trade between the U.S. and Canada.
- 83.5% of the surface trade between the U.S. and Mexico.
American Trucking Industry Statistics by Taxes
- In 2021, commercial trucks paid $29.12 billion in federal and state fuel taxes.
- From January 2023 on, each gallon of diesel fuel will cost $24.4 in federal fuel tax, and each gallon of gasoline will cost $16.4 in federal fuel tax.
- From January 2023, each gallon of diesel fuel costs 33.9 on average in state fuel taxes, and each gallon of gasoline costs 31.6 in state fuel taxes.
American Trucking Industry Statistics by Mileage
A total of 327.48 billion miles were driven by the 13.86 million single-unit (2-axle, 6-tire or more) and combination trucks that were registered in 2021, which made up 5% of all registered motor vehicles. 195.62 billion miles of those were driven by combination trucks.
American Trucking Industry Statistics FAQ
The Hours-of-Service (HOS) regulations vary for property-carrying and passenger-carrying truck drivers. At an average speed of 60 miles per hour, a driver could go 630 miles in a day if they adhere to the 11-hour driving limit and have their obligatory 30-minute break. That works out to 810 miles a day with a 14-hour limit, the same break time, and the same speed. However, averaging those regular miles would be difficult in practice due to delays or stops due to traffic (which may vary depending on your commute), or for restroom or eating breaks.
Working in a truck or in the trucking industry always carries a significant risk in itself. According to a Forbes report, in 2021, more than half a million heavy-duty trucks were involved in the accidents. A year prior, it was 415,444. This is why the Federal Motor Carrier Safety Administration has mandated essential coverage for all commercial trucks.
According to the US Department of Transportation, till April 2023, there were approximately 750,000 operational US motor carriers that owned or leased at least one tractor. Out of those, 95.8% of the carriers run 10 or fewer trucks and 99.7% run 100 or fewer trucks.
The trucking market is really vicious. Since there are few hurdles to entry, there is no lack of trucking businesses (there are about 1.9 million of them), and shippers have many options for who they hire, there is a great deal of competition. Additionally, because there is a great demand for drivers, businesses must frequently court drivers in order to assist them in delivering on their promises to consumers in addition to wooing customers to choose them.
The trucking sector will continue to grow slowly and gradually in the future. A 10 percent job increase for truck drivers is anticipated between 2022 and 2032. Although this occupational growth is comparable to that of the rest of the nation, it does take into account the 2020 COVID-19 outbreak recovery, meaning that its overall rise would have been slower under average conditions.
According to the United States Census Bureau, there are more than 3.5 million people working as CDL truckers in the United States. These CDL drivers are essential to the our country’s supply chain and transportation industries, operating everything from long-haul trucks to buses throughout the nation. The demand for CDL drivers continues to remain high due to the ongoing need for freight movement, particularly in the trucking industry.
Working in a truck or in the trucking industry always carries a significant risk in itself. According to a Forbes report, in 2021, more than half a million heavy-duty trucks were involved in the accidents. A year prior, it was 415,444. This is why the Federal Motor Carrier Safety Administration has mandated essential coverage for all commercial trucks.
According to the US Department of Transportation, till April 2023, there were approximately 750,000 operational US motor carriers that owned or leased at least one tractor. Out of those, 95.8% of the carriers run 10 or fewer trucks and 99.7% run 100 or fewer trucks.
The trucking market is really vicious. Since there are few hurdles to entry, there is no lack of trucking businesses (there are about 1.9 million of them), and shippers have many options for who they hire, there is a great deal of competition. Additionally, because there is a great demand for drivers, businesses must frequently court drivers in order to assist them in delivering on their promises to consumers in addition to wooing customers to choose them.
The trucking sector will continue to grow slowly and gradually in the future. A 10 percent job increase for truck drivers is anticipated between 2022 and 2032. Although this occupational growth is comparable to that of the rest of the nation, it does take into account the 2020 COVID-19 outbreak recovery, meaning that its overall rise would have been slower under average conditions.
Conclusion
During and after the pandemic, a cultural shift in terms of e-commerce consumer sales has been witnessed, which went up around $219 billion in 2020 and is expected to reach over $7 trillion in 2025. This has put external pressure on trucking businesses.
With more than 70% of the total goods of the nation transported by trucks in 2023, which comprises nearly $800 USD + economic value, it is evident that in the future we will need and see more trucks and truckers on the road. And there is another stat to justify that. According to a study, the American population is going to exceed 70 million by 2045, with an increased freight volume of 40%.
Seeing the statistics coming out this way, it is a no-brainer that trucking businesses have huge potential in the market and will keep contributing to the state’s economy in the future.
References
- Economics and Industry Data by AMERICAN TRUCKING ASSOCIATIONS.
- Local Freight Trucking in the US Industry Analysis by IBISWorld.
- Delivery Truck Drivers and Driver/Sales Workers by U.S. BUREAU OF LABOR STATISTICS.
- As the industry works to address a driver shortage, more women are working as truck drivers by CNBC.
- According to the Women In Trucking Association (WIT) in July 2022, female drivers comprise 13% of the driver workforce.
- Employed truck drivers detailed by race, and ethnicity, according to the U.S. Bureau of Labor Statistics
- The median age of over-the-road truck drivers is 46 as per the ATAs Driver Shortage Report.
- The trucking industry is getting more diverse with the swiftly increasing hiring of the LGBTQ+ community.
- Education and training assignments by truck drivers.
- Summary of the HOS regulations for property-carrying and passenger-carrying drivers.Truck Accident Statistics For 2023 report of Forbes.